

 Facebook
 X
X
 Pinterest
 Copy Link
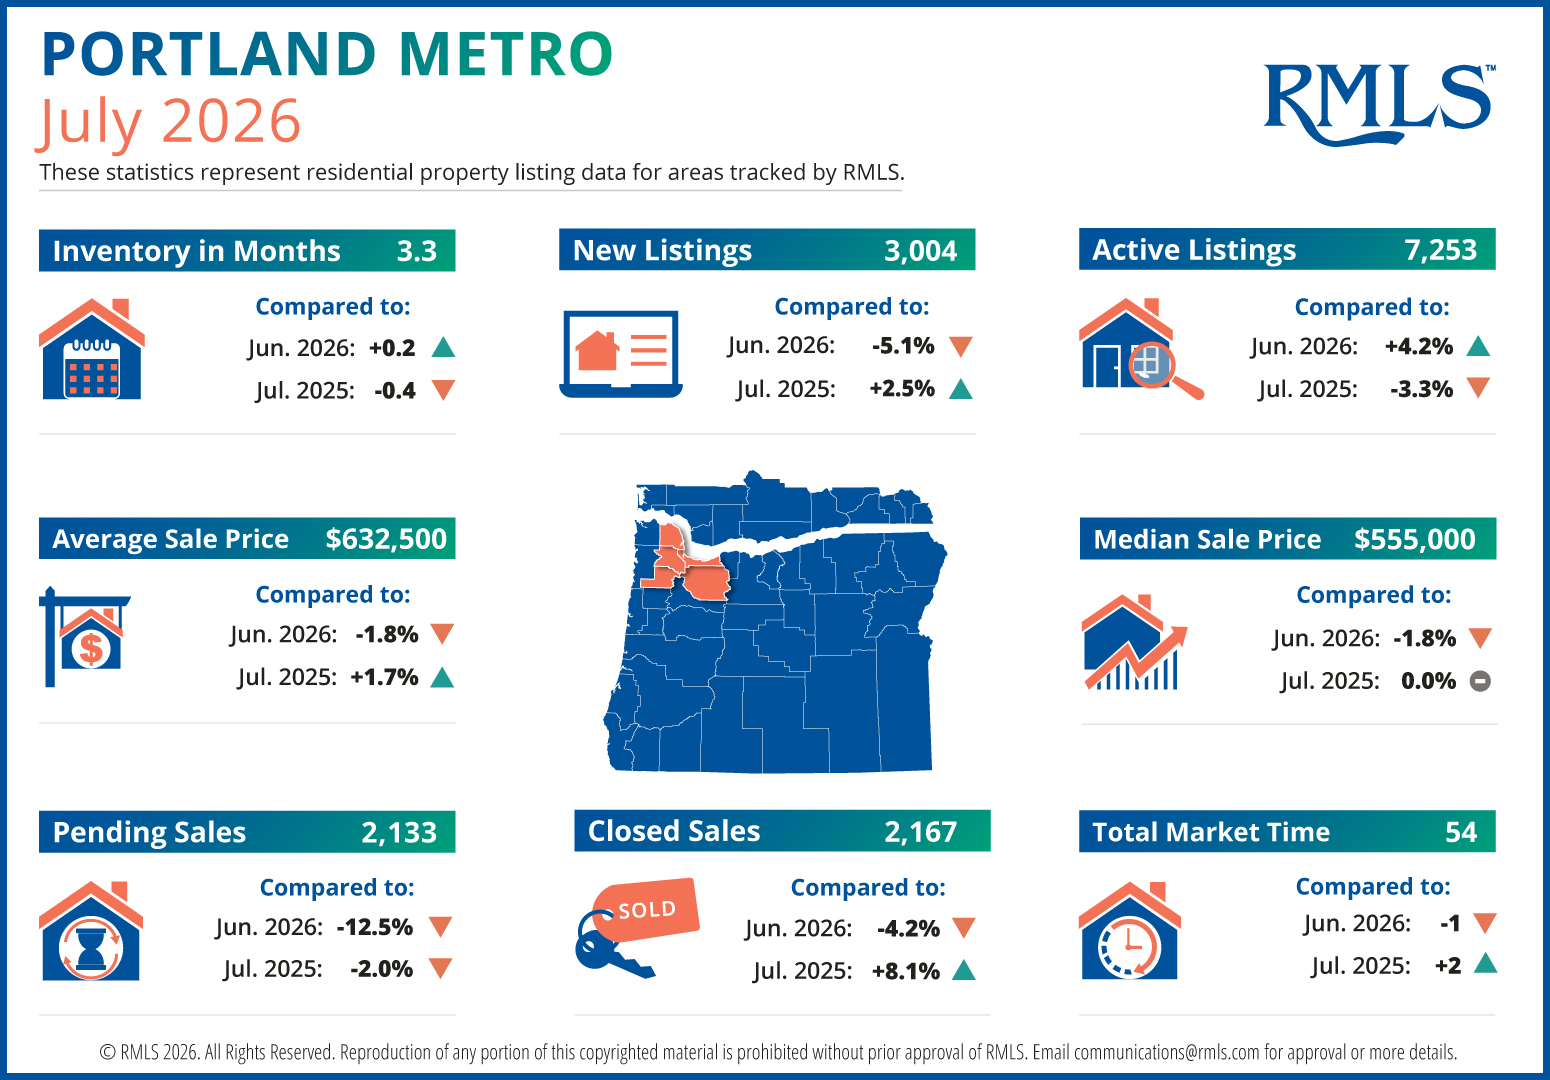
The Portland metro real estate market showed a mixed but relatively balanced picture in July 2026, with inventory increasing from June while overall sales activity remained somewhat slower month over month. Compared with July 2025, however, several indicators point to a market that is showing signs of increased stability and buyer activity.
Inventory Increased, But Remains Below Last Year
Inventory reached 3.3 months in July, up slightly from 3.1 months in June but down from 3.7 months a year ago. The month-over-month increase suggests buyers had somewhat more options than they did in June, while the year-over-year decline indicates that the market still has fewer months of available inventory than it did last summer.
There were 7,253 active listings, an increase of 4.2% from June, but a decrease of 3.3% from July 2025. The combination of more active listings and lower overall inventory compared with last year suggests that while available homes increased during July, the market remains relatively well balanced rather than becoming heavily weighted toward buyers.
New Listings Showed Seasonal Slowdown
Sellers brought 3,004 new listings to the market in July. That’s 5.1% fewer than June, but still 2.5% higher than July 2025.
The month-over-month decline isn’t necessarily a warning sign. Summer listing activity can fluctuate, and July often sees some seasonal moderation as homeowners and buyers navigate vacations and summer schedules. More importantly, the year-over-year increase shows that sellers are still entering the market at a slightly higher rate than they were last year.
For buyers, this means there continues to be a steady flow of new opportunities, even though the pace slowed from June.
Pending Sales Declined
Pending sales were one of the softer areas of the July market. There were 2,133 pending sales, down 12.5% from June and 2% from July 2025.
The significant monthly decline suggests buyer activity cooled during July. However, the year-over-year decrease is relatively modest, indicating that the market hasn’t experienced a dramatic drop in demand.
Pending sales can also be influenced by the timing of contracts, interest rates, seasonality, and the number of homes available that meet buyers’ needs. The decline is worth watching, particularly if pending sales continue to fall in the coming months.
Closed Sales Tell a More Positive Story
Despite the decline in pending sales, 2,167 homes closed in July, down 4.2% from June but up an impressive 8.1% from July 2025.
This is one of the more encouraging statistics in the July report. While closings declined from June, the substantial year-over-year increase indicates that more transactions ultimately made it to the closing table compared with the same period last year.
The difference between pending and closed sales is also important. Pending sales represent current buyer activity, while closed sales reflect transactions that were initiated weeks or months earlier. The strong year-over-year increase in closed sales suggests that the market continues to generate meaningful transaction volume.
Home Prices Remain Relatively Stable
The average sales price in July was $632,500, down 1.8% from June but up 1.7% from July 2025.
The monthly decline is relatively modest and may reflect normal seasonal fluctuations as well as the mix of homes that sold during the month. More importantly, prices remain higher than they were one year ago.
The 1.7% year-over-year increase suggests that home values are continuing to appreciate, but at a relatively measured pace. This is a much different environment from the rapid price increases seen during the strongest periods of the housing market. For buyers, that can mean somewhat more opportunity to negotiate, while sellers can still benefit from the underlying stability in home values.
Homes Are Selling Slightly Faster Than Last Month
Total market time was 54 days, down one day from June but up two days from July 2025.
The relatively small month-over-month change indicates that the overall pace of the market remained remarkably consistent. At the same time, homes are taking slightly longer to sell than they did a year ago.
For sellers, this reinforces the importance of pricing a property correctly from the beginning. Buyers have options, and homes that are priced competitively and presented well are more likely to attract attention quickly.
What the July Numbers Tell Us
Overall, July’s numbers paint a picture of a balanced Portland metro housing market rather than one clearly favoring buyers or sellers.
The market has more active listings than it did in June, but overall inventory remains below last year’s level. New listings are up compared with last year, while closed sales are up a notable 8.1%. At the same time, pending sales have softened, suggesting that buyers may be becoming more selective.
Perhaps the most important takeaway is that the market is not moving dramatically in either direction. Prices are modestly higher than last year, homes are taking only slightly longer to sell, and transaction volume remains active.
What This Means for Buyers
Buyers may find a little more breathing room than they had earlier in the year, with active listings increasing 4.2% from June. However, inventory remains below last year’s level, so desirable homes can still attract competition.
With the average sales price at $632,500 and prices up 1.7% year over year, buyers may benefit from taking a strategic approach: comparing properties carefully, understanding local market conditions, and being prepared to act when the right home becomes available.
What This Means for Sellers
Sellers continue to benefit from relatively stable home values and a market where inventory remains below last year’s levels. However, buyers are not rushing into every property. The 54-day total market time and decline in pending sales suggest that pricing and presentation matter.
A well-priced home that shows well can still stand out, while properties priced above current market value may require more patience or eventually a price adjustment.
The Bottom Line
July 2026 was a month of moderation for the Portland metro housing market. Inventory increased from June, new listings remained above last year’s level, and closed sales were significantly stronger than they were a year ago. At the same time, pending sales declined and homes are taking slightly longer to sell than they did last summer.
The result is a market that appears more balanced and stable than either an overheated seller’s market or a rapidly shifting buyer’s market. Buyers have opportunities to be selective, while sellers can still benefit from healthy demand and prices that remain above last year’s levels.
As we move into the second half of 2026, the key indicators to watch will be pending sales, inventory levels, and whether the year-over-year growth in closed sales continues. These numbers will provide a clearer picture of whether the current market stability continues through the fall.


